🔎 Project Overview
The objective of this project is to develop a comprehensive credit card dashboard that delivers real-time insights into critical performance metrics, trends, and customer details. This dashboard empowers stakeholders to effectively monitor and analyze credit card operations, ensuring informed decision-making and operational efficiency.
📊 Dataset Description
Credit Card Details Dataset
Contains key metrics like Client_Num, Card_Category,
Annual_Fees, Credit_Limit, Total_Revolving_Bal,
Total_Trans_Amt, and more.
Customer Details Dataset
Includes demographic information like Customer_Age, Gender,
Education_Level, Income, and Cust_Satisfaction_Score.
📊 Visualizations Used
Bar & Column Charts
Line Charts
Tables
Slicers
KPI Indicators
Cards
Treemaps
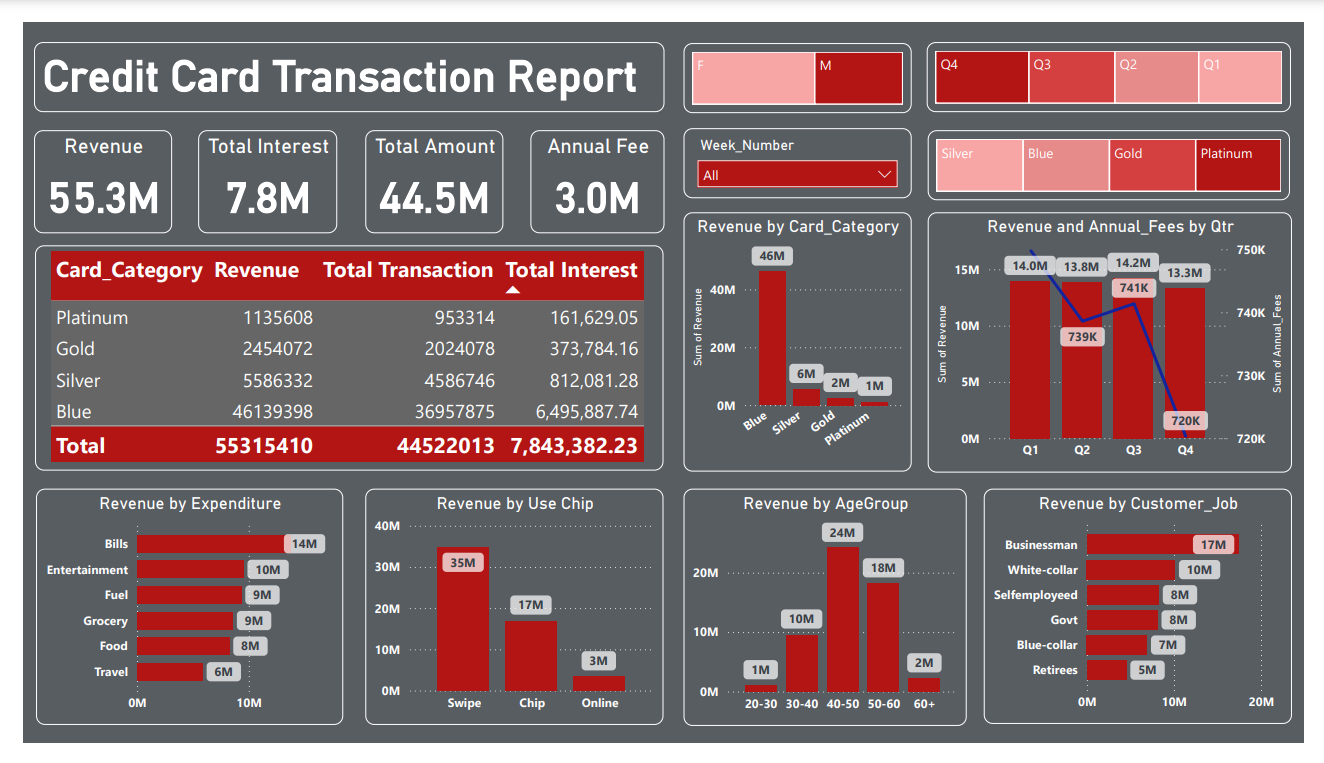
📝 Dashboard Insights
Revenue Analysis
- Total Revenue: $55.3 million
- Bills: Largest expense category ($14 million)
- Swipe Transactions lead revenue ($35 million)
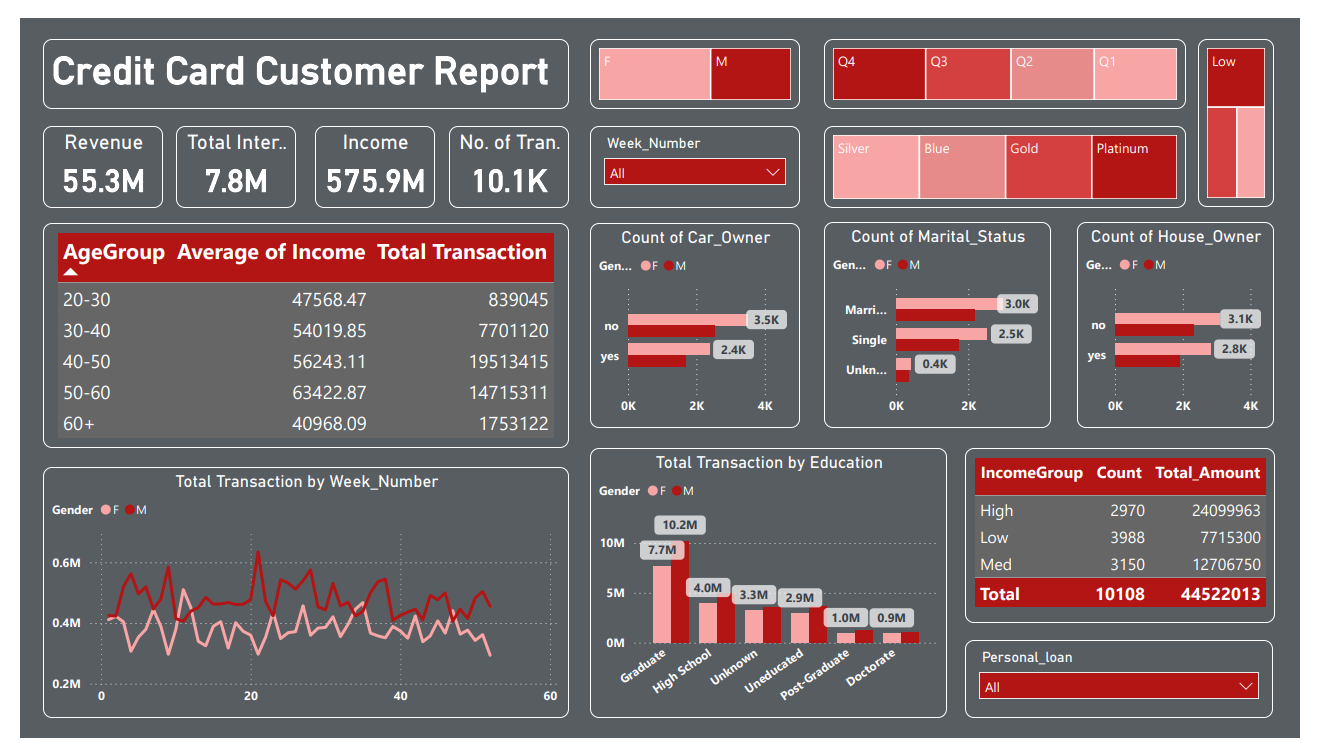
Customer Segmentation
- Top Spenders: Age 40-50 ($24 million)
- Businessmen generate $17 million
- Gender Split: Male ($31M) vs Female ($26M)
Temporal Trends
- Third Quarter had highest revenue
- Female transaction volume typically lower than males